The problem is not measuring – it is measuring without knowing what for.
Imagine this: every month, Daniela – quality manager at an 80-person manufacturing company – opens four different Excel files, copies data by hand into a fifth, calculates some percentages, and generates a PowerPoint report that the CEO looks at for three minutes before saving it in a folder that no one ever opens again.
That’s not indicator management. That’s indicator theater.
The problem is not that Daniela does not know what to measure. The problem is that no one has defined what each number is for, who acts when the result is bad, or how it relates to the company’s real objectives.
ISO 9001 requires organizations to measure, analyze and evaluate their quality management system. But the standard doesn’t tell you how to do that in a useful way. That’s up to you – and to be clear about what questions you want your indicators to answer.
This article covers the full picture: what the standard requires, what types of indicators you need, how to set them up, how to interpret them, and how to avoid the most common mistakes. If you already have a QMS in place but feel that the numbers aren’t telling you anything actionable, this is your starting point.
What ISO 9001 says about quality indicators (without the language of the standard)
ISO 9001:2015 does not use the word “indicator” explicitly, but requires them in several ways. The key points are:
- Clause 4.4 – You must determine the QMS processes and establish criteria and methods to ensure that they operate and are effectively controlled.
- Clause 6.2 – Quality objectives must be measurable, monitored and communicated.
- Clause 9.1 – The organization shall determine what needs to be monitored and measured, how and when to do it, and when to analyze and evaluate the results.
- Clause 9.3 – Management review includes reviewing the performance of the QMS – which implies having hard data on indicators.
In plain language: the standard requires you to know what is happening in your system, to measure it regularly, and to use that data to make decisions. It does not tell you how many indicators to have or in which tool to store them. That freedom is, at the same time, the most common source of confusion.
Source: ISO 9001:2015 – Quality management systems. Requirements
The types of indicators needed for a real QMS
Before going into concrete examples, it is worth understanding the classification. The indicators of a QMS can be grouped into three levels:
Strategic (system) indicators.
They measure whether the QMS as a whole is fulfilling its purpose. They answer the question: is the quality system working?
Typical examples:
- Customer satisfaction index
- Number of major non-conformities in external audit
- Percentage of quality objectives met
Process indicators
Measure the performance of specific processes. They answer: is this process operating as it should?
Examples: production cycle time, non-conforming product rate per line, delivery schedule compliance.
Result/product indicators
They measure the quality of the direct output. They answer: does what we deliver meet the requirements?
Examples: internal rejection rate, return rate, compliance with technical specifications.
Most QMSs in SMEs have only result indicators, and lack process and strategic indicators. This is like measuring only the symptom without looking for the cause.
Indicators by process: an unfilled guide
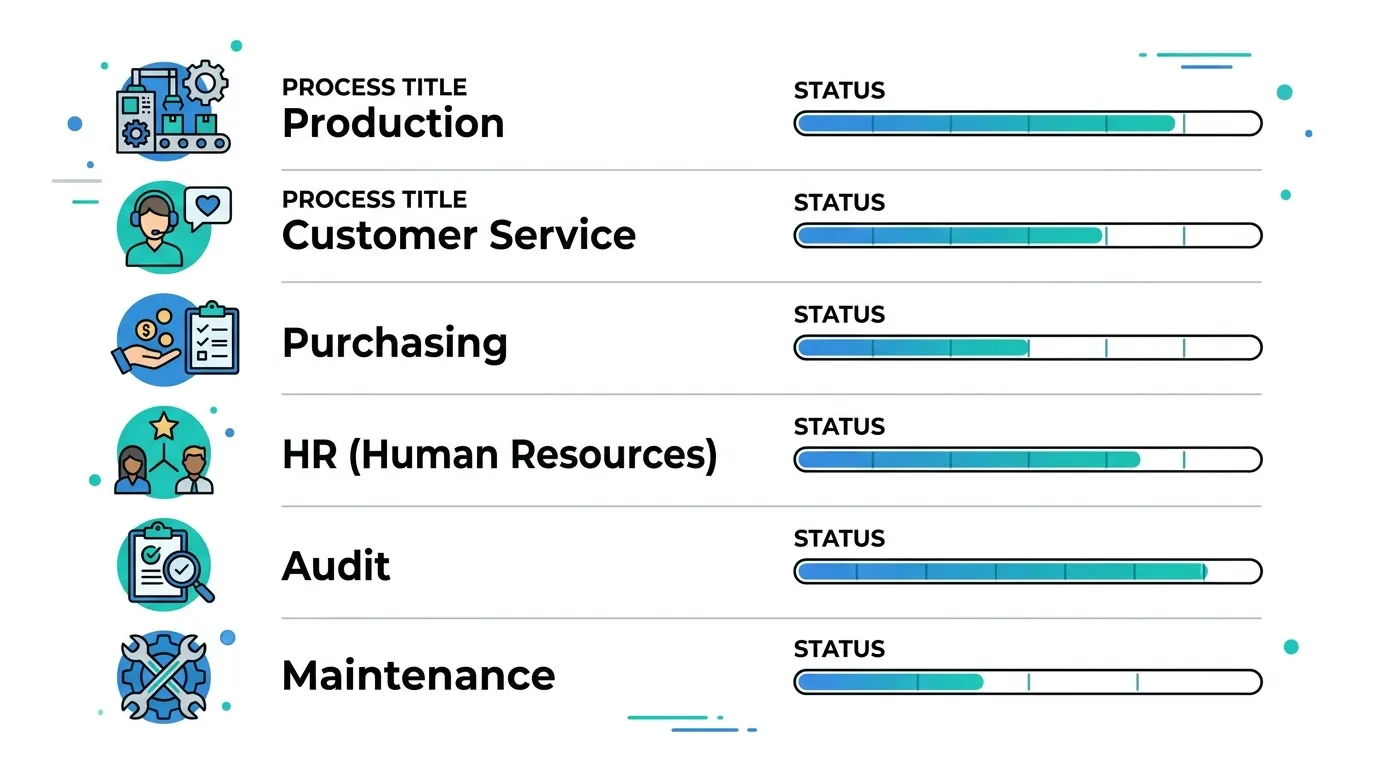
Here is a practical selection by area. It is not an exhaustive list – it is a starting point for you to adapt to your context.
| Process | Indicator | Basic formula | Suggested frequency |
|---|---|---|---|
| Production / operations | Non-conforming product rate | (NC units / Total produced) × 100 | Weekly or monthly |
| Customer service | Satisfaction index | Average score in survey / max. scale | Monthly or per transaction |
| Purchasing / suppliers | On-time delivery rate | (On-time deliveries / Total deliveries) × 100 | Monthly |
| Human resources | Compliance with training plan | (Trainings executed / Planned) × 100 | Quarterly |
| Internal audit | Closure of corrective actions | (CA closed on time / Total CA) × 100 | Monthly |
| Maintenance | Equipment availability | (Time available / Total time) × 100 | Monthly |
Two important clarifications:
- The formula is not the indicator. The indicator also includes the target, the responsible party, the data source and the scaling criteria. Without that, it is just a percentage.
- Less is more. An SME with 5 well-managed indicators has more control than one with 30 that no one checks.
If you want to delve deeper into how to organize this data by process, the article KPIs of a QMS: which ones to measure and how to interpret them by process breaks down each area in greater detail.
How to establish an indicator that someone will actually use
Defining an indicator correctly takes less than 10 minutes if you are clear about what you need to know. The problem is that it is often defined without thinking about who is going to use it and for what purpose.
A minimum indicator sheet should have:
1. name and description Clear and without acronyms. “IPR-01” tells no one anything. “Rate of product rejected on line 3” does.
2. Objective or answering question What are you measuring this for? If you can’t answer in one sentence, the indicator is probably not well defined.
3. Formula and unit of measurement Exact, unambiguous What goes into the numerator? What goes into the denominator? Percentage, absolute number, index?
4. Goal and tolerance range Not just “we want to improve.” A specific goal: ≤ 2% rejection rate. A warning range: between 2% and 3%. A critical limit: > 3%.
5. Data source and responsible for measurement Where does the data come from? Who captures it? If this is not clear, the indicator will not be measured consistently.
6. Frequency of measurement and review Not everything is measured at the same rate. A production indicator may be measured weekly; a customer satisfaction indicator, monthly or quarterly.
7. Responsible to act when there is deviation This is the most ignored and the most important. If there is no proper name assigned, no one acts.
To measure well the part of customer satisfaction, which is often the most neglected indicator in SMEs, it is worth reviewing Customer satisfaction in ISO 9001: effective methods to measure it in an SME.
How to interpret results without them being just numbers
Measuring without interpreting is the equivalent of having a thermometer but not knowing what temperature is a fever. There are three levels of interpretation that every quality manager should apply:
Level 1: Are we on target?
Compare the result against the defined target. This is the most basic level and the only one used by most QMSs. “Are we there?” Yes or no.
Level 2: What is the trend?
A 3% rejection rate can be good or bad depending on whether it was 5% or 1% last month. The trend matters more than the single data point. Graphing the last 6-12 periods gives you immediate context.
Level 3: What is causing the variation?
When an indicator goes out of range, the question is not “who failed” but “what changed”. This is where root cause analysis tools come in: Ishikawa diagram, 5 whys, Pareto analysis. The indicator points to the where; the analysis finds the why.
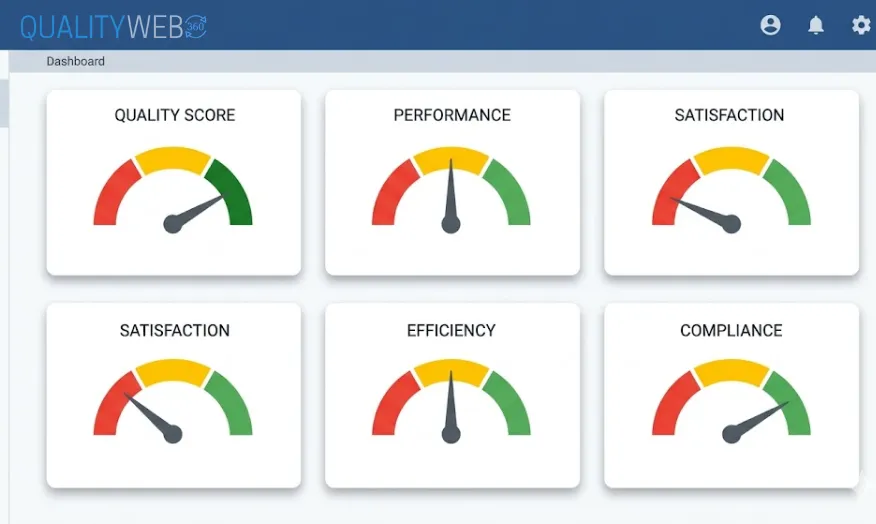
A good indicator dashboard doesn’t just show the current number – it shows trend, status against goal and alerts when something goes out of range. If you want to see how that is structured in practice, the article QMS Dashboard for SMEs: daily operations on a single screen explains how to organize QMS indicators in a daily management view.

Common mistakes when managing indicators in an SME
These are not theoretical – they are the patterns that appear over and over again.
Measure what is easy to measure, not what is necessary Nonconforming product rate is easy to count. Customer-perceived quality is difficult. Many QMSs have ten production indicators and no customer indicators. That has a collection bias that distorts the picture of the system.
2. Indicators without an owner “The quality area follows up” is not enough. Each indicator needs a person with a name and surname responsible for collecting the data and escalating when there is a deviation.
3. Goals copied from the previous year without review A goal that no one has questioned since 2019 probably no longer reflects the reality of the business. Targets should be reviewed at least once a year, ideally at the management review.
4. Confusing reporting with analysis Generating the monthly report and mailing it is not the same as reviewing the indicators. The review involves asking: what is causing this? What are we going to do differently?
5. Too many active indicators Having 40 indicators in theory and 5 that someone actually reviews is worse than having just the 5. Tracking capability in an SME is limited – design the system for what you can actually operate.
Where to start if you are starting from scratch (or from a chaotic Excel)
If your current QMS lives in spreadsheets and shared folders, the goal is not to replace everything overnight. It’s to start tidying up incrementally.
A reasonable starting point:
- Identify the 5-7 key processes of your QMS (those that have the most impact on the quality of your product or service).
- Define one indicator per process, using the 7-point scorecard described above.
- Set initial targets based on your historical performance, not on what “sounds good”.
- Assign a responsible person per indicator – this is non-negotiable.
- Define a monthly review routine with the relevant people.
The mistake is to try to implement everything at the same time. Start small, prove it works and then expand.
If you don’t quite know where your QMS stands today, the free QMS Maturity Diagnostic can give you a baseline in 10 minutes. It identifies the most critical gaps and gives you a concrete starting point.
And if you already have a clear diagnosis and are looking for a tool to centralize tracking, QualityWeb 360’s Indicators and KPIs module allows you to define tabs, record results, visualize trends and generate automatic alerts – without parallel spreadsheets.

Additional source: ISO 9001 Performance Evaluation – ISO.org
Frequently Asked Questions
How many indicators should an ISO 9001 QMS have?
The standard does not establish a minimum or maximum number. What it does require is that the indicators be sufficient to assess the performance of the system and key processes. In practice, a well-managed SME can operate with between 8 and 15 active indicators – enough to cover the main processes without overloading the monitoring team.
What is the difference between an indicator and a KPI?
Technically, all KPIs are indicators, but not all indicators are KPIs. A KPI(Key Performance Indicator) is an indicator linked directly to a strategic or critical business objective. In a QMS, KPIs are usually the strategic level indicators – the ones that management reviews in the management review. Process indicators are more operational and may not be “key” in the strategic sense.
How often should indicators be reviewed?
It depends on the type. Production process indicators can be reviewed weekly or even daily. System indicators (customer satisfaction, achievement of objectives) are usually reviewed monthly or quarterly. The important thing is that the frequency is defined in the indicator sheet and that someone is responsible for carrying out the review.
What do I do if an indicator is consistently off target?
First, verify that the goal is realistic – sometimes the problem is that the goal is poorly defined, not that the process is failing. If the goal is correct, apply a root cause analysis (5 Whys or Ishikawa), define a corrective action with a responsible party and timeline, and monitor if the indicator improves. If it does not improve after the action, repeat the cycle in greater depth.
Are quality indicators the same as financial indicators?
No, although they are related. Quality indicators measure the performance of the QMS and processes. Financial indicators measure economic impact. However, the two must talk to each other: a high rejection rate has a direct financial cost. Connecting quality indicators to their cost impact is a powerful way to justify QMS investments to management.
Is Excel sufficient to manage QMS indicators?
Excel can work in early stages or for very simple systems. The problem arises when data lives in separate files, there is no version control, several people edit simultaneously, or traceability of changes is lost. As the QMS grows, the risk of errors and the administrative burden become difficult to sustain. It’s not that Excel is bad – it’s that it wasn’t designed to manage a quality system.
The next step
Knowing which indicators to measure is the first step. The second – and most difficult – is to build the discipline to review them regularly and act when something deviates.
If you want to know where your QMS stands today before redesigning your indicator system, the QMS Maturity Diagnosis is free, takes less than 10 minutes and gives you a report with the areas of greatest opportunity.
No complicated forms. No commitment.

